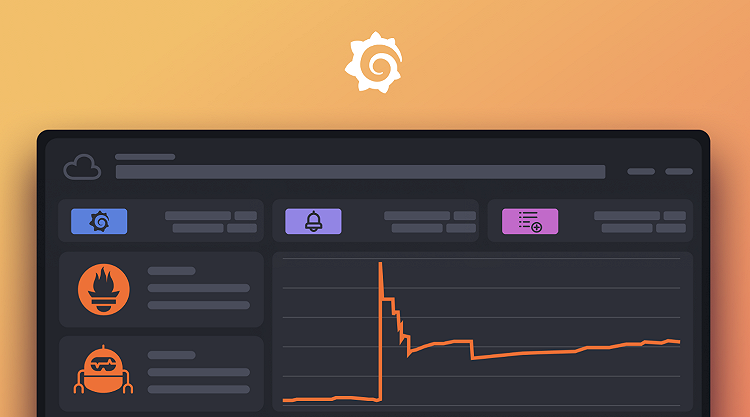
Intro to Kubernetes monitoring in Grafana Cloud
🚀 Date: September 10, 2025
✨ Time: 09:30 PT / 12:30 ET
🧑💻 Speaker: Imma Valls – Senior Developer Advocate
🎯 What You’ll Learn:
✅ How Kubernetes, Prometheus, and Grafana reshaped cloud-native development
✅ The cost of poor Kubernetes observability
✅ What telemetry data is essential to collect
✅ The power and role of Grafana Alloy
✅ How to collect Kubernetes metrics and logs
✅ Speed-to-value and efficient troubleshooting using Grafana Cloud Kubernetes Monitoring
ℹ️ About the Session:
Kubernetes combined with Prometheus and Grafana has revolutionized observability for cloud-native apps. In this webinar, you’ll learn how Grafana Cloud offers developers and SREs an easy-to-deploy, high-impact monitoring stack for Kubernetes. Discover the Grafana Agent, a new UI, and preconfigured dashboards, alerts, and metrics to monitor and troubleshoot with confidence.
🚀 Perfect for:
• DevOps and Site Reliability Engineers
• Cloud-native application developers
• Teams seeking faster, clearer Kubernetes insights
Login or register and follow tags to receive alerts when new events are added and to get a personalized feed of events tailored just for you.
This event is free to attend
Free registration is required to attend this event
Register for Free


