Intro to metrics with Grafana: Prometheus, Grafana Mimir, and beyond
🚀 Date: October 1, 2025
✨ Times: 09:30 PT | 12:30 ET | 16:30 UTC
✨ Online webinar
ℹ️ About the Webinar:
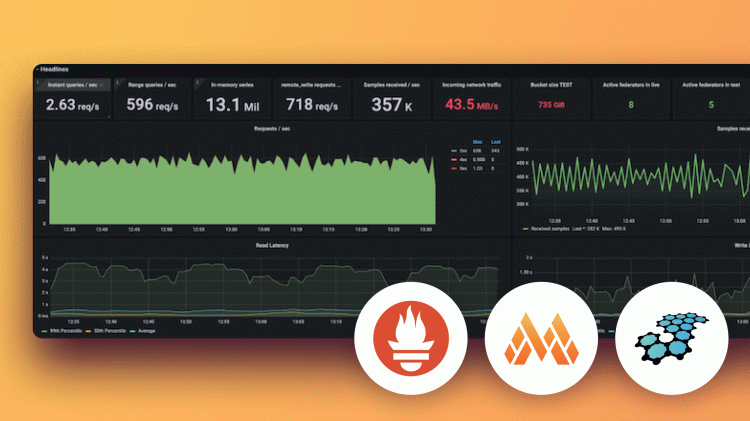
Prometheus has become the standard for metrics management in modern and cloud-native applications. However, enterprises running Prometheus at scale often face challenges around scalability, availability, security, and legacy systems.
In this session, we’ll explore:
✨ The importance of metrics in an observability strategy;
✨ The challenges of scaling Prometheus;
✨ How Grafana Mimir and Grafana Cloud Metrics provide scalable solutions;
✨ How to choose between Grafana’s different offerings;
✨ How to get started with Grafana Cloud using your existing metrics setup.
You’ll learn how to scale Prometheus with Grafana Mimir and query both real-time and historical data in Grafana for powerful visualization and analysis.
🎟️ Your Guide:
Naima Alexander – Associate Solutions Engineer @ Grafana Labs
Login or register and follow tags to receive alerts when new events are added and to get a personalized feed of events tailored just for you.

This event is free to attend
Free registration is required to attend this event
Register for Free