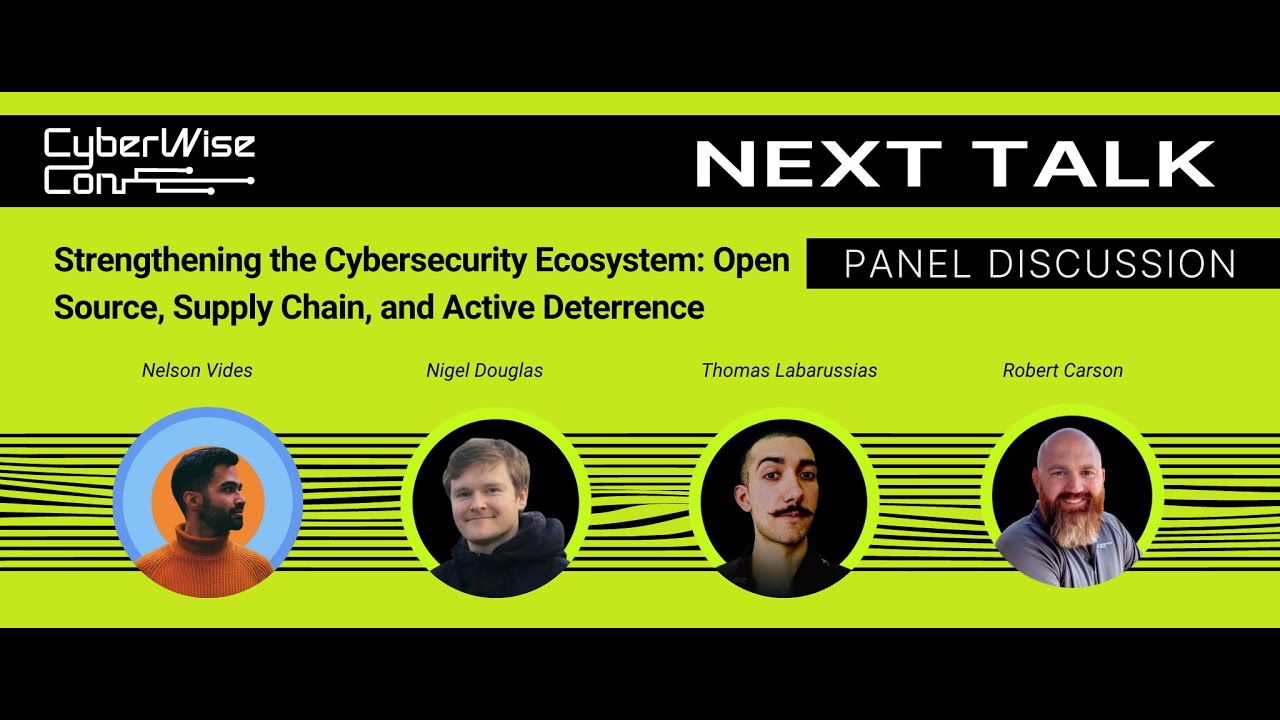
Nigel Douglas, Thomas Labarussias: Remediate Cloud-Native Threats in Real-Time with Talon
About this talk
This talk focuses on mitigations for cloud-native threats using Falco and its new companion tool, Talon. The speakers, both developer advocates at Sysdig, explain that Falco is an open-source runtime security tool that monitors system calls within containers running on platforms like Kubernetes. They elaborate on Falco's architecture and how it processes alerts generated during runtime, including potential security incidents. The speakers introduce Talon, which automates responses to Falco detections, performing actions like terminating pods or applying network policies without the need for extensive coding. They emphasize the importance of context and detailed output from Falco for effective incident response and compliance reporting.
Full transcript
Ladies and gentlemen, please welcome our next speakers Nigel Douglas and Thomas Labarussias presenting the topic remediating cloud native threats in real time with talent. Okay, we're good to go. Um so thank you everyone for attending. Um I don't think you hear any sound, that's just me. Um so yeah, thank you for attending. We're going to show a new designed solution we put together and it's called Falco
Talon. So, can we just start off firstly can people put their hands up if they've heard of Falco or okay, there's a few people at least have heard of the technology. That's good. to start off um I'm a developer advocate at Sysdig and Sysdig's the kind of core company behind the Falco project. But Falco is an open source technology that we'll come to in a second go
but in a while but um yeah, basically we contribute to this project and as well as other projects. Again, you can contact me directly but Thomas, do you want to introduce yourself? Yes, I'm Thomas Labarussias in French. Uh I'm also a senior developer advocate at Sysdig. Before that I was a sorry for almost 10 years. I did 5 years of on call. So, I know what it
is to manage a production. Uh I'm also CNCF ambassador for 9 months now. Uh Falco contributor and I'm also the creator original creator of some tools we introduce to you uh after in the slides and you can reach me on classic networks. Cool. So yeah, today's talk is going to be around runtime security. Um so you might be wondering what we mean by runtime and that's specifically
after you build your application and you deploy and it actually runs in the likes of Kubernetes serverless. It's actively in progress, it's running. Um so that actual containerized workload that's actually present, that is what we're looking to secure in this case. So anything from the pre-procedures, the processes, and the tools used to secure that, um is what we're talking about when we mention runtime security. That's going
to be a a recurring theme. Um so yeah, Falco for the people who haven't heard of the project already, it's um a CNCF graduate project. So again, for quite some time now, for several years, it was an incubation project. And what that meant was we Sysdig donated the project to the Cloud Native Computing Foundation. Um it was there that it went through rigorous trials and tests to
prove that it was um a compliance tool that organizations can, you know, actually run in production environments. Um there's a due diligence process as part of the CNCF graduation flow, uh and third-party auditing so on just to make sure that the application, the tool itself that you put into production, um again, meets all those rigorous requirements. Um so yeah, moving on. Um this is yeah, this is
the part. So we've graduated this year, and this is a fantastic milestone for the project. It means we can happily tell users that this is, you know, the best in class for what it does. So you might be asking, well, what does it do? So we're going to the next slide. Um at its core fundamental, Falco handles system calls. So what a system call is if you
think of the Linux kernel, the kernel like the brain of your machine under the operating system layer, um anytime you create a file, you delete something, a network a connection is invoked, that creates a system call. So if we run a program within the kernel, we can monitor, we have observability as to all the activity, whether it be process, network, IO activity, um within the kernel. And
that this deep visibility is the basis for understanding what is happening on the host, what's happening in the container, and even deeper, what's happening in the process that run within those containers. Uh we'll move on to next slide there. Now, there's two ways of looking at how Falco works. You know, we talked about the kernel module there a second ago, which is just this probe that runs
inside your kernel. Um but not everyone wants to use a kernel probe. There's There's considerations here, like what happens if that probe was faulty? Could it crash my kernel? Yes, in theory it could. And that's a scary process or possibility. So, then eBPF, it's this new project that came along. And what it allows us to do is have another alternative option, which is to run it as
an eBPF probe. Again, runs within the kernel, but it's similar to kind of virtual machine logic. So, it's contained. It's Yeah, it doesn't It can't crash the kernel. It's running separate to the kernel. Um but again, we get that same deep visibility. So, for things like security monitoring, whatever it is on a host system, containers, Kubernetes, we can do that with our eBPF probe. So, moving quickly
on to next slide. This is what Falco looks like. So, you know, it's it's similar to DevOps practices that everyone's familiar with is writing everything in YAML. So, here we have a rule, and the rule has an arbitrary name. And that name is terminal shell into container. It's just, you know, text. It doesn't really do anything. The description, again, same lines as what we mentioned there in
the rule name, is it's the description of what this rule will do. And sometimes you can lengthy descriptions. And sometimes, in this case, it's quite straightforward. It's just telling you it's going to shell a spawn on a container. Now, the condition is where Falco differentiates from other technologies. You can have something that looks pretty simple. It's saying spawn process and or, you know, the Boolean logic, and
you're saying container and shell process. Now, these things that are blue, um those are they can be macros or lists. In this case, they're all macros. So, what I mean by that is if we just go back there a second, you can have this complex business logic. Like, for instance, um if I was defining a macro to look for shell processes, then I want to find what
those processes are. And, for instance, it's going to be based on a certain system call. So, it could be event type, whatever. Um or it could be process type or process name. Whatever the conditions you can define within those macros. The idea here is you manage the macros and the rule stays consistent. It's the same logic you expect. Another thing that's really cool about basing it on
system calls is when you look on the output, we can then say, you know, arbitrary string, which is a statement like a shell was found. And then in those brackets, we define the metadata, the what we're actually extracting from the system call. Now, you can customize this yourself. It's open source. You have free control. You can do whatever you want with it. And we'll just jump to
that now in a second. So, you can see here the logic. So, you know, with a list, it could be something like shell binaries. And it could be a list of binary names. Or if you're doing it based on C2 servers, then it could be a list of IP addresses. So, these are some things that are subject to change and they can be managed in whatever way
you want to do it. Or you can just leave them static if you want. But the idea here is there's complex logic, which is brilliant cuz you need complex logic to identify security instance, whether it be like mutating binaries, privilege escalation, whatever it is, data exfiltration. These are all brilliant use cases. But with system calls, we can monitor effectively anything on a system, which is really cool.
And out the box, we have like 60-plus rules that are already there. So, you can already test the product and understand value. And this is what you expect to see. So, the idea is if we the more metadata fields we're going to put into it or into our output, the more we see that of the output. And that's very important. We don't want to just be alerted
that terminal shell existed. We also want to know all this running context. We want to know, for instance, what was the container ID? That's subject to change regularly. So, maybe I want Kubernetes context extracted in that output. So, I might want to say, "Tell me what namespace it's running in. What's the pod name? What was the deployment associated with it? And further, what was the command line
execution at the time of that operation?" So, for instance, what did the actual attacker or the adversary run in the terminal? So, you can get all this surrounding context and the time to resolution is much quicker. So, this this is a fantastic use case for just showing raw output of a detection. So, moving on. This is a high-level view of the architecture of Falco today. And it
will come to further use case in a second. But, we talked about system calls, and system calls whether you use the eBPF probe or use the kernel module, the KMod, that's how you handle all the context from a system itself. But, let's say you want to correlate context against other sources. Like, a perfect example is I EKS cluster, uh Amazon Elastic Kubernetes Service. Now, I have a
pod and I can monitor all this with system I also have a Kubernetes audit service, which provides audit logs associated with just Kubernetes the orchestration there. And I can use plug-in architecture, which again, open source can build your own plugins, but this handles the audit service of Kubernetes, take that event data, and then enrich it, correlate it against the system calls. Similarly, I could handle CloudTrail through
these gRPC plugins, stream that data to Falco, and if, for instance, I have a process running in a container in a Kubernetes cluster in a cloud provider, I can correlate that context in an output, and that's really powerful. You know, if you're in a security team, you don't want to know a pod did something, you want to know which region, on which cloud account, but also in
which Kubernetes cluster, which namespace. Have as much context around the attack. So, that's the event collection part of it, between plugins and system calls. Then, it streams to Falco, where it has this rule logic that we briefly touched on. And that's how you detect insecure behavior. As I mentioned, incredibly customizable, and it's deep in its logic. So, it means you can, you know, build fairly complex use
cases. Now, traditionally speaking, out of out of the box of Falco, it's simply a detection engine. You know, it's detecting insecure behavior. It's not actually doing anything on that, it's just telling you, like it's sort of like an audit, you know, there's insecure behavior. So, you can then use these out of the box options of streaming to syslog, so it can go to a SIM, or you
can send a HTTP webhook somewhere else. So, you've got these different alert options, but they're not that interesting, you know, they're really just to alert you, to notify you that something's happened, or might be for an audit use case. So, we'll move on to the next slide. Then, we introduce Falco Sidekick. So, this is an pet project of Thomas, and they got introduced into the Falco project
as a whole. And what this allows us to do is two things. It Falco Sidekick has the UI element, and we'll touch down on that in a while, which is a visualization layer for all of the output data. We said it's so rich, it's so detailed. But, if you don't have like a UI, you're just looking in the terminal of all this output, so that can be
a bit messy. But, the other very useful uh element of is integrating with the actual ecosystem that you have. So, if you have like, for instance, queuing services, chat tools, like everyone's using Slack, so you're deciding, okay, I want to be notified in chatbot that an incident happened that's insecure, then detect it through her Or, you might want to put it to pager duty or whatever for
some kind of automation. So, you have all these and Falco sidekick is the notification layer. It's the kind of thing that decides it does all that complex annoying part of integrating with all of your um system tools. And again, at this point we're closer to 70 integrations. So, if you're looking for a dedicated integration, you can get on to us. We probably already have it. So, this
is what the visualization layer looks like. And again, it's just to make life easier. So, imagine you have all these events and depending on the complexity of your organization, you could have event stream data coming from cloud audit logs from GitHub. It could be coming from Octa identity. Again, we've got plugins for all of these kind of use cases. So, you're streaming all that data. It's nice
to have a centralized place where you can toggle, you can search for rules based in time periods, based on priorities and so on. It's a really cool use case. And again, that historical histogram of showing you where there might have been an unusual spike in unusual suspicious activity is really valuable. So, moving on quickly is where we're at today. So, we talked about Falco. Reiterating what we
mentioned earlier, it's the detection engine that handles all that support source data. It then builds rules on it. There's even new features such as Falco CTL, which is dedicated CLI tool for managing the complexity of rules in production. Which again, we're trying to make the tool as easy for users as possible. Then we alert through HTTP webhook to um Falco sidekick, which then can make actions such
as demonstrating all the events within a visualization UI, which you can port forward or load balance to a certain IP. Or you can then stream the events to a third-party source. And that takes us up to the reaction side of it. Do you want to take it from here, Tom or What you prefer. Yeah, um I'll just close off on this one. So, we mentioned there wasn't
a response feature in Falco, and this was frustrating for community cuz they say, "Look, if I detect a crypto miner as an example, it's all well and good, but like I need to stop it. And if it's the weekend or something, it's kind of useless. So, I need something that will kill that miner or do other activities." Again, you want automation, but you also take action. So,
that takes us to the of how we did it with Falco sidekick. That was generally speaking a little bit complex in the sense of you had to understand functions as a service type options. You know, you send it to a service where it decides, "Okay, I'm run a script in the cloud provider or whatever." But, this is all kind of automation reactions. It's not interacting with the
primitives of Kubernetes, and that takes us to your pod. So, basically, even if you're if you're interested by integrating these outputs, these functions as a service serverless systems with sidekick and Falco, we created a series of blog posts on falco.org. They explain how to integrate Falco with Lambda, Knative, Argo Workflow, Tekton. So, you will have example anyway. So, having developing its own response engine has some benefits
for sure. Total flexibility because basically, you are the developer, so you manage your function by your own. You develop whatever you need. So, you have a full control over the actions. don't depend on a third party. You don't depend to a SaaS platform except for the cloud provider running the the the function. Um you can also use processes and services you may already have in your company.
If you are already familiar with Lambda, you should already have the CI and the CD to deploy Lambda. Your developer should already may already be uh familiar with how to develop with serverless uh some also um these frameworks how to develop a lambda function for with this framework. But, and every benefit comes with a drawback of some drawbacks. You need to develop by your own the actions
to manage errors, the authentications, the logs, the notifications. If you ever tried to develop something for Kubernetes, to call the control plane API, it's not obvious, especially for beginners. Uh you have to manage so many complexity managing the dependencies with the file Kubernetes SDK is not really easy. You It may require to install and manage new services, new CI workflows, new CD workflows if you don't already
use um function as a service system. You may have latencies, especially with lambda because it uses cold start. So, you have to wait your lambda to spawn and then And if you want to chain actions, basically do that and then do that and do that, it's not so easy to do so, especially if you are not really familiar with queuing system to manage the communications between one
function to another. So, we decided to develop a project Talon for humans and for birds is that what. So, basically Talon is for kicking asses. This is the main idea for marketing. Um so, we created a tailor-made response. Same thing for Falco. The idea behind was to provide to the community someone out of the box uh you don't you don't have to write any line of code
to to specify your Um it's pretty convenient. Basically, Falco Talon will receive the alerts from Falco directly or from Falco Sidekick, your choice. And with rules, in the same way that Falco does the correlation between a syscall event and an alert, Talon will do a correlation between a Falco event and a reaction. A reaction means several one or several actions to perform. And these actions basically uh
can use on out of the box on catalog what we call actioners. So, right now we have 10 out of the box actioners. You can terminate a pod, labelize a pod, uh create a network policy, execute a command, run a script, uh get the logs. Uh this one is pretty is interesting because you can get the logs of your pods just before terminate it. You can delete
a service account, a user, um a deployment, a daemon set, everything that is not a pod. Call down a node. The drain actioner is is a work in progress right now. We have Calico. Cilium will come in few I think maybe at the end of this month of June. And we also have lambda function, like we have also in psychic, but with more parameters. Everything is managed
by YAML rule files, so it's quite easy to to to extend. We can override anything and you you can manage that in a GitOps manner. It's that's the purpose. These actions can be triggered based on the priority of the event, the tags, the source, the Falco rule name, and what we call the output fields. Output fields are all the elements that have been collected by Falco to
create the rules. And what we have we had that in the output section of the rule files for Falco, of the rules for Falco. Basically, it's all elements the which are dependent of the context. The pod name, pod name space, pod labels, container ID, container the and so on. So, you can, for example, create a rules to terminate only uh except if this pod belongs to the
name space cube system, for example. I wish The actions can be sequential. We also have the duplication of the alerts from tabs. Sometimes to times, Falco can trigger can trigger the same alert twice or three times. Uh so, we'll not try to terminate the same pod three times. It's better to deduplicate these events. We also have out-of-the-box notifyers. So, you can notify your teams by Slack, email,
webhook, uh collect the logs in Loki, Elasticsearch to create nice dashboards after. We know managers love dashboards. And we also have communities events. So, it's easy for everyone to get access to what Talon did. We don't want to have a black box. We want to be sure everyone will be aware of what has been done by Talon and when. And the logs are structured to have trace
ID. Uh it's specially we integrate soon traces. So, in you will have traces uh directly made by Talon to have the reception of the event, the correlation between the rule and the action, all actions that have been triggered, the results of all actions, and the notifications at the end. And we also provide Prometheus metrics it's a standard now. So, this is the This is an example of
a Talon rule. Basically, we have a rule with a name uh like we have in Falco. We try to keep uh spirit between Falco and Falco Talon to to don't lose people. So, we have a match session. The match match session is in charge to do the the actions. So, in that situation, if Talon receives an event concerning the Falco rule name right below UTC. And this
rule doesn't concern the the name space called cube system, then these actions will be triggered and in will be performed. First one is open the file with the action script. The script is just over there. So, we just equal the content uh of the file. Uh with the shell with a sh a shell. You can change that by for bash. Fish if you are more than you
use fish in Uh and the the second action is to terminate the pod. But, we ignore the demon sets. We ignore the stateful sets. And if we don't have enough uh healthy replicas, we avoid to terminate that pod. Uh I was a sorry for 10 years like I said, so I prefer to keep my production alive and just notify my team something strange is happening. Take a
look manually. And I don't want uh an automatic remediation that could break my production and impact my end users. we don't want that. You can see we have a block on all the rights called action. Basically, you can create a block action and reuse it like we can reuse macros in Falco rule. And you of course, you can override the parameters at every level. It's basically uh
it's easy. So, we don't you don't have to write the same action for every rule. If you have a terminate action, you can just create and reuse it from one rule to another. Yeah, and we can't emphasize enough when you match more than one action to a Falco rule. Like this is you could say a unique approach now when we're talking about cloud native security. Cuz like
let's say if you had a tool and you said we're going to terminate a workload, but then you lose the logging context on the pod. So, maybe for instance if you want to take an action to say like you can see here, you define your parameters and you say grace period in seconds. You can then have a rule that would say something on the lines of let's
say do some forensics, whatever the check is, give us the surrounding data, ship that somewhere, and then have a second action on the same rule that says terminate the workload after 8 seconds if you want. That way you can actually have the flexibility to ensure that you do get the surrounding context collected from it, but you also get to mitigate the risk. So, I think that's pretty
amazing. Yeah, right now we are preparing It's a working progress on your side, but we are writing a blog post to explain if something bad is happening in your pod, we could collect the logs of the pods, then we cordon the node, then we drain the node, and then we terminate the node at the Amazon level by just killing calling the Amazon API stop that that EC2.
So, this is the main idea. So, the situation right now with the whole ecosystem, we have the syscall collections with eBPF, we collect any events that possible possible events with the plugins. For example, I don't have that right now in my demo, but I developed a plugin to collect all Bitcoin transactions. the idea was to demonstrate we can collect any kind of event with Falco and trigger
alerts. And so, I have triggers when one suspicious wallet receive or send money Bitcoin. Um just because I've been they tried to scam me. So, I I get their I got their wallet ID and I'm tracking them to be sure no one else will be impacted. Um before I had a Twitter plugin, so we'll see the interface after, but it's not possible anymore because we have to
pay to get access to Twitter API. But before people were were able to tweet in real time and with specific hashtag, and all tweets were coming in my in the background in my in the UI in in real time. So, we have Falco for Falco for the detection, Falco Psychic for the notification. A good thing also with Psychic, Nigel didn't mention that, but with Falco Psychic you
can you can do a small routing system. So, for example, you can send all your events to Elasticsearch for analytics, for statistics, and you can send the alerts to PagerDuty, OpsGenie, Alert Manager, Grafana and all only if the events has a priority as a priority above critical, for example. So, you can filter a little bit and avoid to wake up your SREs or DevOps SecOps, whatever the
name, uh too too often. And we have Talon at the end to react. So, we'll try the demo. Cross the finger, sorry. I have a running uh AKS cluster in that situation. I have three nodes. from because having three nodes and Falco is deployed as a daemon set because it has to be connected to the kernel and every and right now kernels are not distributed, so we
need one Falco instance per node. You see why I have this one, this one, and this one. We have Falco Psychic, Falco Psychic UI. The Redis This Redis pod is a data storage back end for Psychic for Psychic UI. And we also have Talon. I created I will not show the Falco the Falco rules because the file is pretty big. Um but that situation we have this
one. This is the Falco Talon rule set. Basically, I created that can be reused from from one rule to So, this action is to terminate a pod. This one is to create a net Calico network policy to block outbound connections. This one is to labelize a pod, so it will have a label suspicious equals true. This other one is to have the label spawn equals true, and
it will remove the suspicious label. And the rule is there if we collect the Falco rules terminal shell in the container, basically is the the rule which which we we had in the slide before. And this this this event doesn't concern cube system of Falco, then we'll have the label suspicious. If a package manager is started inside a container or inside a pod in the and once
again, this pod doesn't this this pod doesn't belong to cube system or Falco namespaces, we'll labelize the pod as spawn and remove suspicious. we write something under under the {slash} etc, we'll get the content of Uh if we if we connect to suspicious IP that could be a crypto miner, uh server, uh control center for for botnet, we'll first create the create the Calico network policy to
blocks all future network connection outbound connection, and we then will terminate the pod with grace period of 0 seconds. Terminate the pod, terminate the pod. This is basically the idea. uh ta-da And it's a really good like Chris, while you're setting that up, you know, when you're doing it as an API approach, like Kubernetes was designed for automation. So, like you want to automate based on those
existing primitives. Um and that's I think where it's this project is different. You know, we're not telling users to stop using network policy. Instead, we'll block network traffic. We're instead saying, "Define network policy if you want." And then, based on suspicious action, we can label eyes it, which would enforce the network policy. Either way, we connect to the existing Kubernetes primitives um that were already defined long
before this project. And um that's the way I think security should be done when it comes to Kubernetes, but you know, you'll see it in a second. So, I have this pod, this running pod. Consider it lies you, your beloved application. Can be whatever. For example, WordPress with so many CDs. Um, you can take a look at the levels. We only have app and pod template hash.
So, I will just I will just exact to get a bash um shell into that pod. So, we have we have access to that pod. We are in the pod. And if you can take a look at the levels, now we have we should have suspicious. Uh, if I take a look about on the Falco we have the event. So, this is event received by Talon. The
match between Talon received between the event and the actions to perform, the actions itself, label as for the suspicious. We also have the status. Everything is notified. Like it's not true. Success. Uh, something there. Status success. And then the notification. If we take a look at the Kubernetes the default namespace, we have all details there also. the status, the message, the rule concerned, so the Falco rule
that has been triggered, the action, the actioner label, the event received by Talon, the name space, and the pod, the output of the actioner. Everything is there. Let's continue. Now, if I take a look about once again to the pod, the suspicious label disappeared, but we have two pods instead. Everything has in the same manner in real time. So, I will write now under /etc, subber wise.
Something like that. Any word? I don't know. Yeah, should be fine. So, I wrote something under /etc, and if I take a look once again on so we have the Kubernetes Z this action has been performed, Kubernetes script, we have the content there. So, if we take a look at the events once script script is there. also there. Uh we have just an LS to be sure
the the file is there, /etc/banana, and we have the content. So, if someone is putting a script inside your pod and runs it, you will have the content. It's Pretty common. And the last seems to show is I will curl my own domain. And we take a look on the on this on the right corner, right bottom corner. So, we curl my own domain. You see, in
less than 1 millisecond, the pod has been terminated. And we also the creation of a Calico network policy. So, two things are happening. Like, the termination ensures the workload That will be blocked. Exactly. and threats mitigated. But, in the scenario where, for instance, it wasn't an instant termination, the network policy anyway blocked the outbound connection. So, even if you wanted to make that connection, it was already
isolated by network Exactly. If I try the same process, if I go back to If I go to the new pod created by the deployment, and I try to curl my own personal domain, once again, it will just fail. And all these events we can't find them. Okay, like both of what curl is. in the UI. So, we have everything that done. The first terminal shell, the
first APT command, the second APT command. this is This has been done by APT. The installation of curl, the write uh of the act by supervisor has been act in the file descriptor on the ETC banana the curl to my domain, the suspicious outbound connection. Everything is detected by Falco, and you found out find them out in the UI in few milliseconds. Of course, you have like
nitro search, you have pie charts, you have you have histogram. You can filter on almost anything. For example, if I just if I want to just critical Everything is filtered. Yeah, and the context tagging is so It's one thing mitigate and isolate a risk, but in a real cybersecurity scenario where you for instance have to generate a report and prove does this match CIS practices or NIST
2, HIPAA, PCI DSS, whatever it is. Having the labels matching those controls means yeah, sure we detected and we prevented the threat, but now you can actually generate for your manager a report showing look, we've met those controls. powerful for pen testing, but actually for compliance in the end, so The demo worked. That's a lot. I think we have been able to be did it very quickly.
Um I guess at this point there's a few questions that have come in. Um how does Falco compare to other SIMs? I mean, starting off with that, first of all, it's not a SIM. Um I think the biggest obvious difference is with a SIM, you have applications or whatever, programs, machines, and they ship their logs to a back end. And that back end then you perform forensics
or kind of alerting based on it. But with this, we're not actually handling the log data. We're not storing it. Like what we're doing is we stream it. It's a streaming approach, so we stream the event through Falco. And then Falco does rule matching on the live stream. So that's how we see things in real time. It's all system calls as they happen, but we don't hold
those logs. Um yeah, that's the major difference. We we aren't um a SIM. The other thing that's really cool about the streaming approach and what we talked about there earlier with the data enrichment is you know, most sims don't do it. So, they handle logs from different sporadic sources and then it's just stored in this tool, which is great and all. But, by streaming and then doing
data enrichment on the streamed events, you can do a correlation against different sources like Kubernetes or cloud audit log. I don't know if there's anything else you wanted to mention on that. I'm not sure to get all the questions, to be honest, because I see what the theme is, but the link with with Google Workspace is not common, but the thing is too, if you are able
to write a plugin to collect events from the Google Workspace, Yeah. you can correlate uh suspicious threat from different sources in the same tool. The idea behind the plugins was to have the same syntax to write rules, whatever the source is. with the syscalls, you can protect your hosts, your containers, your VM. Uh with the Kubernetes audit logs plugin, you can protect your Kubernetes control plane. With
the cloud trail uh for GCP, I don't remember the name of for GCP, but you can protect the cloud uh the cloud account level. You have GitHub webhook uh the GitHub webhook plugin to protect your your your Git repositories uh for example, whatever. Uh we also have plugin to for Okta. Uh you know, Okta has been breached several times in the last month. So, we created a
plugin to detect the exact thing that happened to Okta. MFA fatigue, I think. The next question's about in-memory detection. I guess what you're talking about is fileless malware. Um the answer is yes. We have rules based on like Mimikatz activity. So, yeah, you can absolutely pre-detect in-memory, which is actually again another strong use case for eBPF and kernel level visibility, cuz if you're looking at the user
land, you won't be able to see in-memory activity. But, if it's in the kernel space, yes, you can. Uh when when Talon is running, where is it running? Uh, how can it be executed action Kubernetes service account? Do you want to answer that one? Yeah, sure. Uh, the easiest way to install Falco is through a name shot in the Kubernetes clusters. So, what it will use is
it will use the the service account and also the IM role if you are using EKS, you can do mapping between service account and IM role. Uh, but technically you can run Falco anywhere. If you want it to react and to call the Kubernetes control plane, either you use the service account, either you can give it a cube config file like we do on our laptops. Both
can work and it's not an issue. Uh, then last one. Oh, yes, sorry, there's two questions there. Uh, is there a packet capture functionality? Uh, that was my thing, so I wrote a blog about that yesterday. Um, so the way I approached it is say for instance TShark, which is headless Wireshark. Um, if you had that running for instance in a dedicated pod and you had a
Falco action, which is to reach out to Kubernetes API and run a shell script. Well, that shell script could TShark. So, the use case here was you know, I would terminate a workload but after 10 seconds and in that 10 second period I'm running a Wireshark capture, which gave me the 10 seconds of packet capture around that security incident. Which is pretty cool. We are working on
that for sure. It's surprisingly stable, but the question is there, yeah, like is there any delay? And I guess there is latency. It's always really about how far away from the source it is. Like this was your point about Yeah, basically we trigger a capture, but technically the event already happened. This is big difference between Falco, the open source project, and what our company does above that
with the commercial project. They have a solution to start the capture before 5 seconds prior 5 seconds before or something like that. It's totally different. It's not on the Falco side. Uh just to mention that Wireshark has been created by Loris Degioanni. Loris Degioanni is our boss. He's also the creator of Falco. So, he knows a little bit about what it takes to to do um packet
capture. Uh yeah, is there an easy way to forward detections to a SIM? I guess that's your point around Falco sidekick. Exactly. This is the main purpose of Falco sidekick. We have integrations. Of course, we we um Elasticsearch, but we you can forward the logs to Loki. Splunk, any of them really. They're I think Splunk has If one integration is missing, you can just create an issue.
Um we can see to integrate that in the next upcoming release at the end of July. We have Dynatrace, Sumo Logic, for example. Um MinIO. I don't remember all of them, but Yeah, but the point is the answer is an easy way. It's simple, really. Like you know, Falco's doing all the hard heavy lifting, and then you just pick the dedicated endpoint. I guess there's a bit
of authentication required. But other than that, that's that's it. Can't make it simpler than that. Yeah, your storage retention on Falco Oh, um You can figure that Unlimited retention right now. Uh you can specify a TTL for the events. By By default, the TTL is zero. It means in Redis, we keep the the information forever. And if you want to be sure to have a long-term storage,
uh thanks to Redis, you can we you can have a flush of data on disk. So, if you mount to PVC, a volume, directly in your pod, you you will have unlimited retention. We don't have that right now. Yeah, like we have a histogram that will show the historical activity and that's a little bit of end user interpretation of okay, well, there was no activity yesterday and
now there's a spike today. Why is that? But that's not like a feature. The UI became much bigger than I expected, to be honest. I created that something like 4 years ago because I needed something nicer to to show in my demos. Before I I only have the in terminal to show to display. It wasn't really sexy for people. So I created the first version of the
UI. People liked it, so it became a more advanced project and people liked it more, so it became bigger and bigger. I cried a lot of blood because of JavaScript for that. my advice is not is not to use that in production for long term. You use that out of the box when you install Falco to have an overview of what is happening in your cluster right
now. Use it to tune your rules and you when you are confident enough about what you implemented for Falco, use real SIM elastic search, Dynatrace, Sumo Logic, Loki, whatever to for long term retention and to have better dashboards, more control. It's just debugging tool. It's not really made for big production. I'm conscious we're probably on our last minute, is that right? Um it's just this is really
a closure slide. Um we mentioned a lot of abstract logic there like things between the packet capture example or network policy and sometimes users maybe just want to come back and read it. So we put two QR codes there. One to our Sysdig blog but one to the Falco project blog. And they're both around Talon response actions but it's like if you're more interested in isolating network
behavior and you want to do something around that with Talon, then that's an interesting blog, but the assist one is yet about the T-shark example, so I don't know, they're fun starting points. And yeah, that's it. If you want to contact us we have some details here, but other than that, I hope the session was useful. If you want the slides, just reach us and everything is
open source, so you can you can use them, everything you All slides or blue colored words have a link directly linked to the element, so you you will not have to search on Google after.